June 2016 Google Algorithm Update – Analysis and Findings (But Was It Panda or Another Quality Update?)


Summer is here, and it could be a hot one. Earlier this month I noticed some major volatility, which led me to believe there could be a major update brewing. For example, I tweeted this last week:
Increase During June 2016 Google Algo Update
That’s a huge swing for that website, so I definitely took notice. Also, there was a connection with the November 2015 update (Phantom 3), so I was interested to see if there were more examples like it. Well, the past few days yielded even more volatility, with some websites surging and others dropping. And after digging into more drops and surges, it’s pretty clear that Google rolled out a major algo update in June.

June Algo Update – Important Dates

Specifically, I saw movement on June 1, June 8, June 21, and then more movement on June 26. Now, I’ve covered many times that Google can roll out an update followed by a number of “tremors”, which are tweaks to the algo to fine tune the results. We could be seeing those with the most recent volatility.

Examples of Impact (Positive and Negative)

Before I continue, I wanted to provide a few screenshots of the impact I’m seeing. It’s all over the board. Some sites surged, others tanked, others surged then tanked, and vice versa. There’s a lot of movement going on right now, that’s for sure.
Decrease Then Increase During June 2016 Google Algorithm Update
Steady Decrease During June Google Algorithm Update
Increase During June 26 Google Algorithm Update
Surge During June 21 Google Algo Update With Decline on June 27
Increase During June 21 Algo Update With Decrease on June 26
Major drop during June 21 Google Algorithm Update
What Are We Dealing With? Penguin, Panda, Phantom, or another animal?
In March, I documented a series of updates that looked extremely Panda-like to me. It was the first time in a long time that I could say that. Also, we learned last week from Gary Illyes that each Panda cycle can take months. It’s part of Google’s core ranking algorithm, it continuously rolls out, but it can take months to complete a cycle. So, if this is Panda, it does make sense timing-wise. We are a few months out from March (enough time for the previous cycle to complete).

Then we have Google’s quality updates (AKA Phantom). That’s where Google made a change to how it assesses “quality”. We saw Phantom 2 in May of 2015, then the September 2015 updates, which looked connected to Phantom 2. And then we saw what many called Phantom 3 in November of 2015. That was a big update with major connections to previous quality updates.

So what are we seeing here? It’s hard to say… it could be Panda, or it could be Phantom (a quality update). I was initially leaning towards a quality update, but after analyzing more data, it very well could be Panda. Regardless, it looks quality-based (content quality, horrible user experience problems, aggressive advertising, usability barriers, etc.) These are problems I have seen while analyzing both Panda and Phantom over the past several years.

Also, I know sites that worked hard to fix some of those problems that increased during the June updates. So again, in my opinion, I believe this was a quality update or Panda.

The big question is did this have anything to do with Penguin? That’s always possible, but I don’t think so. First, I’m not seeing signs of links causing problems. More about that soon. Second, Google did say it would announce Penguin 4, so I’m not sure this had anything to do with our cute, black and white icy friend. I guess we’ll see if Google explains more about this update over time.

Problems and Potential Factors

I’ll quickly cover some of the problems and potential factors I saw while analyzing sites that saw negative and positive impact. Note, this is not an exhaustive list of problems and factors, but ones that stood out to me based on my experience analyzing algorithm updates like this one. These were also some of the most interesting situations I saw during my travels.

Sponsored Posts ABOVE The Content

Talk about a usability nightmare. Seeing a large list of sponsored thumbnails linking to third party sites at the top of the article is not exactly the best approach for users. And this site got hammered during the June update. It’s ok to provide content recommendations to third parties, but don’t overdo it. If you do, you could end up getting hammered.

2/3 Ads, 1/3 Content

Boy, is that a recipe for disaster. Checking a site that dropped significantly yielded pages with two thirds ads and one third content. Below the main content there were many, many ads. It was overwhelming, even for someone like me who analyzes this stuff on a regular basis. And this was occurring all over the site. Then boom, June arrived, along with an algo update. Not good.

Answering Questions, Barely

There was a site focused on Q&A that had many ultra-thin pages. Some with no answer, some with ridiculous answers that clearly wouldn’t be helpful for people, etc. I dug into a number of queries and landing pages that dropped and I can see why. Forum and Q&A content can have high quality content, but site owners must manage content properly. For example, don’t let every post be indexable… Only index your highest quality content.

Generic Content, Ads Weaved Into Main Content (MC)

I analyzed one site that seemed to have provided very generic content that could be found many other places (for the topic at hand). Actually, it looked like they took publicly available information and slightly rewrote it. And then they weaved ads into the content (the ads matched the content enough that I almost clicked the ads thinking it was the content on the page). This was going on all over the site.

Interesting Situation -> Desktop Horrible, Mobile OK

I checked one site that saw a major increase during the June update that got hit by the November 2015 update. When checking the desktop version of the site, it looked like minor changes had been made. That had me wondering why the site recovered. In other words, it still wasn’t a great user experience. But, checking on mobile yielded a much smoother, less aggressive approach. I’m not saying this was 100% why they surged back, but we know mobile is incredibly important, and their user experience and advertising situation was much, much better on mobile than desktop. Just an interesting side note.

Indexing Issues – Collateral Damage

A site I’ve been monitoring that went through some major changes this spring just dropped significantly on 6/21 and then more on 6/26.  There was a big indexing issue based on robots.txt problems, which may have led to Google simply not being able to understand a lot of content on the site. The site has had quality problems in the past, but really turned things around a few years ago. The changes this spring, along with the indexing problems, seem to have led to a drop during the June algorithm update. Be careful when you make serious changes to your site. You could become collateral damage. Scary, but very possible.

Opening Reviews The Right Way

Another site that saw an increase had made some major changes with how it handled reviews for products. In the past, they canonicalized all review pages to the first page. That means Google would not index those additional pages, and all of those reviews. They began using a stronger approach using rel next/prev and the proper use of rel canonical across the reviews. That’s across every product on the site. More quality user reviews means more quality content overall. And enabling Google to consolidate indexing properties from across the reviews can help as well. There was a 60% increase in indexation (of quality content that’s connected via rel next/prev).

And I saw much more…
 
I can keep going here, but based on what I’ve seen, the update looks content quality and user engagement-based versus inbound links-based. And regarding Phantom versus Panda, they are very similar factor-wise, so it’s hard to say 100% that it was a quality update versus Panda, or vice versa.
I’ll post additional updates as I learn more. Again, this looks like a big one. Check your stats. :)

Summary – A Hot Start To The Summer Algo-wise?

To quickly recap, there was major volatility in June, especially on specific dates like 6/1, 6/8, 6/21, and 6/26. The algorithm update looks like a “quality update” or a Panda update based on what I’ve seen.  Remember, we haven’t seen a Panda-looking update since March, so it’s definitely possible. And regarding Penguin, we are still waiting for Penguin 4.0 to roll out. I don’t think this is what we are seeing, based on everything I documented above. I’ll try and learn more about the June update and share what I can. Good luck.

Article Source: http://www.gsqi.com/marketing-blog/june-2016-google-algorithm-update/
How to Use Six Google Analytics Reports to Complete a Website Content Audit

How to Use Six Google Analytics Reports to Complete a Website Content Audit

I'm a big believer that every good content marketing strategy begins with a comprehensive audit of the website’s current performance. The simple reason is that you cannot plan ahead if you do not already have a great understanding of where you currently are.

In this article, I will show you how a content audit with six important Google Analytics reports can help you make some smart decisions about the health of your current site, what your audience wants from your content, and how you can benchmark your performance for future content marketing efforts.

The six reports include the following:
  1. Channels report
  2. Landing Page report
  3. New vs Returning Visitor report
  4. Frequency & Recency report
  5. Site Search report
  6. Behavior Flow report
Now, these aren’t the only reports you should use in your content audit, and you don’t need to be a Google Analytics doyen to gather insights from these reports, you just need to know what you’re looking for.


For the above-mentioned reports, we will aim to answer the following questions about content on your website:
  • How is my audience finding my content? (Channels report)
  • Which content piece is performing the best in terms of traffic, engagement, and conversion? (Landing Page report)
  • What should my content performance benchmarks be? (Landing Page report)
  • Do I need to prioritize building an audience; or should I nurture my existing audience? (New vs. Returning report)
  • How many pieces of content do I need to create a month? (Frequency & Recency report)
  • What are the topics I should be talking about, but are not? (Site Search report)
  • Is my content successful at driving business transactional goals? (Behavior Flow report)
  • What is the value of my content? (Behavior Flow report)
First, though, some housekeeping: In order to create a comprehensive content audit in Google Analytics, you need to create some Advanced Segments.

Advanced Segments

Advanced Segments allow you to separate the data into any number of important groups. For the task at hand, I would normally create two primary Advanced Segments and call them Converters and Non-converters.
A Converter is any visitor who has completed a Goal, Transaction, or Event on your site, while Non-converters are visitors who did not complete one of these key performance indicators (KPIs). The reason I segregate these audiences for a content audit is to keep a focus on what behavior or content is creating lead/sales opportunities and what is not.
To create an Advanced Segment for visitors who completed a Goal, click the "+ Add Segment" tab:
Adding an Advanced Segment
Then go to "New Segment" and click "Conditions." Where it says "Ad Content," type in "Goal Completions" to be greater than zero per session. Then select "OR" and type in "Transactions" to be greater than zero per session.

Steps for creating an Advanced Segment

For comparison's sake, you can make a "Non-converters" Advanced Segment with the same Conditions, except use "=" in step 3 instead of ">".

Caveat: If you don’t have any Goals or Events set up in your Google Analytics account, then these Advanced Segments will not be much use to you. But don't despair. Instead, look to segment your visitors by softer goals, such as those who visited your content (for example, your blog) and those who did not. To do this, go to "Conditions" in the Advanced Segment menu, then choose the "Landing Page" dimension; "starts with" and the blog’s location, for example, "/blog/."

Blog destination Advanced Segment

Again, you can also flip this to see the behavior of all visitors who did not visit the blog by choosing the same Condition but selecting "does not contain."

Does Not Contain

This audience can tell you a lot about why your blog is not capturing these people and what you could do to drive more traffic to these URLs.

Save these Advanced Segments as you will need them in some of the following reports.

Calendar

The second housekeeping feature is pinning down a consistent time frame to assess the reports. I like to use two-time frames to compare performance in a content audit:
  1. The last three months
  2. The last 12 months
These two time frames allow us to factor in things such as seasonality, which can potentially affect traffic numbers, but you can use whatever time frames best suit your business and content.
Ok, now on to the six reports.

1. Channels report

Where is it?
ACQUISITION > ALL TRAFFIC > CHANNELS
Questions it will answer:
How is my audience finding my content?
Which channels are creating the most leads?

Channels Report


This report is useful for understanding where your visitors are coming from and which channels are the most effective sources for your content.

Using your "Converter" Advanced Segment, you can see which channels are driving the best quality of traffic and conversions to your website. This can help you identify where you need to improve your content marketing.

Two key things to look out for in the Channels report are:
  1. Which channels are delivering the most traffic to your site?
  2. Which channels are delivering the best quality traffic to your site?
There is a difference. For quantity, look at the Acquisition metrics; for quality, consider the Behavior metrics and the "Goal Conversion Rate."

For example, if you are pushing your content out on your social media channels and are seeing high bounce rates and a low Average Session Duration, this could mean your social media audience is not finding the content they want. Or, it could also mean that the content they see on your site does not properly represent what your social media snippets are promising.

Alternatively, it could indicate that your content may not be displaying well on mobile devices (where most social media traffic tends to come from), and is giving users a bad mobile experience. All of these insights can help you better optimize your content distribution strategy.

Another example: If you are getting a lot of traffic from the "Email" channel but not many conversions, this tells you that you might need to improve your call to action (CTA) in your email marketing.
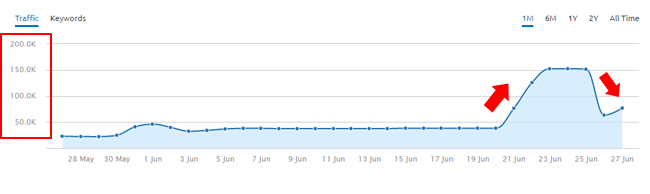
Benchmarking channel performance

Also, keep a keen eye out for weekly or monthly patterns in traffic in the line graph under the "Explorer" tab. If, for example, you are seeing a spike in traffic every Thursday, look at which channel is bringing in that traffic and try to figure out why that’s the case.
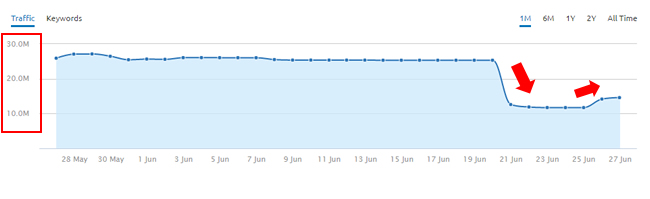
Likewise, if you send out a monthly eDM on the 20th of each month and see a huge spike in traffic on the same day, check the Channels report to confirm that the spike is coming from Email.

Investigating Channel Spikes

2. Landing Pages report

Where is it?
BEHAVIOR > SITE CONTENT > LANDING PAGES
Questions it will answer:
What is the most popular content (in terms of performance)?
What type of content to create for your audience?
What benchmarks should you set for future content efforts?

Landing Pages report


The Landing Page report allows you to see some real performance results around the content currently on the website. If, for example, all your blog content is housed under the same sub-folder ("/blog/"), then a quick way to check the top-performing content is to use the search bar in the report and paste in that section of the URL (for example, ‘/blog/). Using this search bar will only show you URLs that contain ‘/blog/’ on the site.

Those who have a tidy content management system (CMS) might be able to view this directly in the "Content Drilldown" report instead.
Search bar for Landing Pages Report

So, what are you looking at with this report? Simply put, the pages where visitors first land on your website from an external source (such as social media or Google). The top 10 pages are ranked by the number of sessions.

Do you see any patterns in terms of topics, site location, content type? These could be indicators of what content your audience finds valuable.

Next, look at the Behavior metrics for these top 10 posts. How is the audience engaging in terms of Bounce Rate and Avg. Session Duration? Your goal is to think how you can improve these numbers?

Now, select your "Converters" Advanced Segment to see which pages are bringing in the highest converting audience, which is important if your goal for content is to drive leads from the blog.

Following this assessment, take note of the channels that are driving traffic to these top-performing blog posts. For example, pushing something on Outbrain or a paid sponsored Facebook post is likely to drive more traffic than an organic post. You need to be wary of this, as amplification techniques can manipulate the results.

To find which channels are creating the most successful content, click on the blog post URL in the report and then select "Secondary Dimension" and type in the words "source/medium."

Secondary dimension to find source

This deeper report will tell you which channels are driving the most traffic to that specific blog post.
You now know which pages are performing best in terms of traffic, engagement and conversions, and which channels are bringing in these audiences. Your final step is to set some content marketing benchmarks.

The Landing Page report will give you the average figures for Traffic, Bounce Rate, Avg. Session Duration, and Conversions (if you have Goals set up). If this is your first content audit, take these averages as your quarterly benchmarks. They are your KPIs for the next quarter. Your goal is to improve all these results over the next three months.

For example, the last three months' performance was 21,000 sessions. This equates to 7,000 sessions a month. Your benchmark should be 7,000 sessions with the goal to surpass this. Adjust each quarter and if you are doing things right, you will see a steady climb in metrics over time.

Traffic KPI
Engagement KPI
Goal KPI

Note that the Landing Page report uses Sessions instead of Pageviews. A Session starts when a user first lands on your website, while a Pageview counts all views of that page anywhere in the visitor’s path through your site. As most visitors find your content externally and only tend to consume it once before leaving that page, Sessions is a more reliable indicator that your content is working.

I have seen other content strategists use Unique Users and Users to measure performance. I feel these are a good way to measure the human experience on your website over time. It is a matter of preference.

3. New vs. returning visitors report

Where is it?
AUDIENCE > BEHAVIOR > NEW vs RETURNING

Questions it will answer:
Depending on your marketing goals, this report shows you how successful your content is at building brand awareness (new visitors) or nurturing an existing audience (Returning visitors).

New vs Returning Visitors

The New vs. Returning report is vital if you’re looking to understand which type of content marketing strategy to pursue; especially for content marketing goals that revolve around audience growth (e.g., brand awareness, email signups, and engagement).

This report is not so much focused on leads and sales as it is on giving insights related to building and nurturing an audience higher up the conversion funnel. It’s an important report because it reveals whether your current content is doing a good job at introducing your brand to potential customers.

To start, I like to make this report simple to read by clicking the pie-shaped symbol so I can see the split.

New Vs Returning Pie Chart

The insights of this report depend on your business goals.
  • New audiences: Businesses such as startups or bloggers should look to increase the percentage of new audiences to their site. Likewise, if your goal for the next three months is to build brand awareness through content, you will want to aim to increase the percentage of new visitors to your site as a KPI. Increases in this area indicate that your content is reaching new eyeballs. Moreover, consider the customer lifetime value (CLV) of your product or service. If the product or service you sell does not normally require a second visit in a three-month period (for example, it is usually a one-off purchase or service such as smash repairs or annual insurance quote or university course enrollment), then you should also focus on bringing in new audiences (and therefore new leads) to your site.
  • Returning audiences: On the flip-side, if you have an established content strategy, a recognizable brand name or your site has a membership or login wall, you will want to ensure you have a healthy percentage of Returning visitors. This audience needs to find content that is compelling and consistent. The value of the Returning visitor is that these people are likely consistent consumers of your content or regular purchasers of your product. They are also potential advocates for your brand. We will look closer at Returning visitor behavior in the Frequency and Recency report.
Once again, use your Converter and Non-converter Advanced Segments to see which group of visitors is helping the business attain its goals on your site. This can help you realistically plan a content path that drives conversions.

Look specifically at your Returning audience visitors that are non-converters. These are people are usually your most loyal content consumers. Their behavior is strange. They keep coming back to your site again and again but are not converting. Why?

Perhaps they love your content, but have no need for your product? Perhaps your UX from the blog to a product page is not smooth? Perhaps they are waiting for you to develop a product they actually want? Perhaps your content is appealing to a demographic you had not considered being a customer? Here is an opportunity to make some real change to your business.

These people are a captured audience of loyal followers that will be the easiest to convince to convert if only you can figure out what they need to complete their buyer journey. So look at what this audience is doing and think about how their behavior can influence your actual business decisions.

4. Frequency & Recency report

Where is it?
AUDIENCE > BEHAVIOR > FREQUENCY & RECENCY
Questions it will answer:
What is the optimal amount of content I need to create each month?
The Frequency and Recency report simply shows you how often your audience returns to your website in two ways:
  1. The average amount of times (sessions) a visitor has on your site
  2. The average amount of days between these sessions
When you first open this report, you will see that the first row of the ‘Count of Session’ table will have by far the most traffic. This is because it also includes all New visitors to your site. You will want to filter these out. You really only want to see the behavior of Returning Visitors. You will need to create a "Returning Visitor" Advanced Segment.

Returning Visitors Advanced Segment
Returning Visitors Advanced Segement 2
Once this is set up, your session numbers for "1" in the "Count of Sessions" report should be zero.
Count of Sessions report
  • Count of Sessions report: This report will tell you the number of sessions the average Returning Visitor had on your site. Look for patterns in volume. For sales and leads, the goal here is working out how to reduce the number of sessions per visitor. For audience acquisition and nurture goals the task is the opposite, how can you increase the number of sessions per visitor?
  • Days Since Last Session report: This report can help you plan how much content you need to create per month. For example, if you notice you are seeing spikes in returning traffic between 8–14 days, this could mean people are coming back to consume content once a fortnight. Likewise, if 15–30 days has a spike, this could correlate with your monthly eDM.
Days Since Last Session report

Often you will notice that the zero bar shows the largest amount of traffic. This means that most Returning Visitors "return" to the website within 24 hours. Now, this is certainly possible is someone comes to the blog, reads content, then leaves the site to research reviews of your product before returning on the same day to make a purchase.

However, if you have your Advanced Segment filtered by "/blog," the more realistic pattern of behavior is that they came to the site to read the blog, then left the tab on their browser open for longer than 30 minutes. At this point, the session expires. If, after that half hour, they return to the tab to view more content, they will be counted as a new session.

Such behavior is perfectly normal, but keep it in mind when looking at the Frequency and Recency report, as it can play with your results.

5. Site Search report

Where is it?
BEHAVIOR > SITE SEARCH > SEARCH TERMS
Questions it will answer:
Identify what your audience wants from your content
What they are struggling to find on your website
What content topics are missing

Site Search

The Site Search report looks at what visitors to your website type into the search bar within your website. It is a good indicator of what your audience wants to do on your site or what they are struggling to find.

Most websites are built with audience intent in mind, which means the results in the Site Search report only reflect a fraction of the visitors to your site. As a result, what you find in this report should not dictate your content marketing topics but it is worth looking at how many times people are typing a common word or phrase into the search bar.

An example is a client of mine, which is a university: When we looked at the Site Search report, we saw regular searches for words like "unit guide," "Handbook," and "unit guides," which told us that people researching what the university offers were finding it difficult to find content about their courses and potential study paths.

Our solution was to make the university course handbook available to download on the homepage. Searches for the handbook plummeted. Likewise, audiences searched for "important dates," "timetable," and "calendar."

Again, what this told us was that people wanted to see what events were ongoing for a particular month at the University, but they could not find where this content was housed. Thus, we created a widget on the site that allowed visitors to find events and exam times.

Site Search results

Think of the Site Search report as a visitor "feedback" section of your site. It allows you to identify gaps in your current content strategy or user-experience problems with the website.

6. Behavior Flow report

Where is it?
BEHAVIOR > BEHAVIOR FLOW
Questions it will answer:
Where is your audience going after they have landed on your blog page?
Has the content been successful in driving people to the next stage of the funnel?

Behavior Flow

We, as content marketers, often put so much time and effort into driving traffic to our content that we don't put much thought into what happens after they've consumed it. I've been guilty of this many times and when it comes to assessing content performance, I would use Behavior metrics such as Bounce Rate or Avg. Session Duration and make assessments on content performance from there.

While these metrics are important, your assessment of the content performance is only half done, simply because as such metrics don't really give you any insight into one of the most important questions content marketers need to be answering: How is content contributing to the success of my business? This is where the Behavior Flow report can be useful.

All content marketing campaigns need to have goals attached to them. By goals, I mean what is it that you want the content to do for your site and business? They could be to drive leads, email subscriptions, or whitepaper downloads. One of those goals could even just be traffic going to a specific page.

Ask yourself, which pages on your website would you consider a "conversion" page? These are pages where, if someone lands on them, they have shown 'customer intent' and are a potential lead.

My opinion is that a conversion page is any page on your site that allows for the researching of your product/service or business. Of course, these include your product pages, but could also include your Contact Us, About Us, or Case Studies pages.

Testimonial pages may be another one, as visitors here show they are researching your business and your body of work. Therefore, they might be considering you or your product.

In the case of the Behavior Flow report, you want to see how many visitors from the content that you produce go on to visit one of these "conversion" pages.

Let’s look at a scenario: If someone comes to your blog via Facebook, they might consume the blog content and then choose to visit your Case Studies page, I would consider this experience a soft goal conversion for your content marketing campaign. Why? The blog content did its job of moving the visitor to consider you or your product. What you do with this information is up to you, but your next step could be to re-market to this visitor with more content or even your product via Facebook pixel Re-targeting.

To use the Behavior Flow report, you need to set a filter to only see the "blog" URLS. Do this by clicking the cog wheel and filling out the Customize Dimension Items:

Behavior Flow report by landing page
Behavior Flow Report by Landing Page 2

Next, select a URL that you want to review in the "Starting Pages" column. Then start looking for those "conversion pages" in the chart.

In the example below, we can see that two visitors landed on the "who-we-are" pages and one visitor filled out a form and received the "Thank-you" page screen.

'Conversion' pages

In total, the Behavior Flow report shows this blog post was essentially responsible for three conversions.
These conversion pages must then be weighted in terms of value. If you suppose that a visitor to About Us is worth $5 to the business (2 visitors x $5 =$10) and the Thank You page is worth $150 (=$150), then you can surmise that this piece of content made your business $160. This report is valuable for ascertaining a potential ROI and content budget for future campaigns.

There are many factors that can influence a user’s behavior path and it is up to you to A/B test the performance of such behavior. Play around with the CTAs on the site for three months and then measure the performance of those CTAs in the Behavior Flow report.

Conclusion

In order to get better results from your Google Analytics data, I highly recommend you look into some more advanced content metrics such as setting up Events and Goals that align with your business, as well as creating specific UTM cookie campaigns to enable successful A/B testing of things like headlines and social snippets.

I've had great success using the plan detailed above. I'm certain you can do the same.

Please share your thoughts in the comments below.

About Daniel-Hochuli — I am is a Senior Content Marketing Strategist and Editor at King Content in Sydney, Australia. Over the years, I've written or been involved in many strategies for clients such as Lamborghini, pwc, Unilever and IBM. I have an unhealthy obsession with data, analytics and how an audience moves around content and in my spare time, I nerd out on ancient history (particularly Late Republican Rome) and write short stories.

Article Source: https://moz.com/ugc/how-to-use-six-google-analytics-reports-to-complete-a-website-content-audit?utm_content=buffer54dba&utm_medium=social&utm_source=plus.google.com&utm_campaign=buffer

7 SEM experts weigh in on the biggest AdWords announcements

What do advertisers need to start thinking about now, and what are the underdog announcements from Google Performance Summit?

Sridhar Ramaswamy, SVP of ads & commerce, presenting at Google Performance Summit

Google made a flurry of announcements at its annual Performance Summit, held this year in San Francisco and livestreamed on May 24. (You can find all of our coverage here and here.) Unlike in years past, the coming changes this year will affect every AdWords advertiser, whether big or small — the most obvious being bidding levers for all devices and expanded text ads. But there were also announcements — such as dynamic native display ads on mobile, similar audiences for search and GDN targeting expanding to other ad exchanges — that will likely also have a big impact on advertisers.

Search Engine Land checked in with several paid search marketers to find out what they think of the big news and some of the hidden gems Google touched on last week.

Biggest applause: device bidding for all devices

This was the easy gift to advertisers, and I don’t believe I’ve heard one negative comment (other than “About time”) on this change. It received big applause during the keynote.

“Advertisers have been waiting for more device flexibility since Enhanced Campaigns were released,” said Caitlin Halpert of 3Q Digital. “I’m really excited about the increased flexibility we’ll have for our clients, since almost all have unique performance for all three device types. Enhanced Campaigns seemed designed to force advertisers into bidding on mobile and tablets wherever possible. Giving back the control will be a game changer.”

“After years of complaining about enhanced campaigns and the merger of desktop and tablet bids, we finally have our control back,” said Justin Freid, who specializes in SEM and social for the pharma industry, who noted the predominance of mobile in international markets.

What remains to be seen is what advertisers will do differently now that base bids by device type are feasible — revert to device-specific campaigns?

“The new way to anchor bids to other devices could be used to once again build device-specific campaigns, like mobile-only,” says Martin Rottgerding, head of SEM at Bloofusion Germany. “I can also see advertisers using this for device-specific ad groups. Both could be used to decouple device bids entirely: Instead of using bid adjustments, you could again bid directly for different device types. With mobile-preferred ads going away, I can also see advertisers using them for device-specific messaging (‘Shop now from your phone!’). I doubt there’s much to be gained by this, but I wouldn’t be surprised if people invested a lot of time in this.”
While most of the attention on device bidding has focused on the ability for advertisers to have more control over mobile spend, as well as the ability to bid down tablets, Halpert says, The new control for tablet will have a big impact. We have a small set of clients where tablets are our best performers. Being able to push spend on that device specifically will help those clients grow their business.”

Sophie Newton of BrainLabs, who attended the event in San Francisco, agrees. “We’re really excited to have the flexibility of tablet bidding — hello again, 2013!”

In a guest appearance on Marketing Land Live on blab.im on Friday after Google Performance Summit, Brad Geddes, of Adalysis and Certified Knowledge, discussed the GPS announcements, including device bidding and Expanded Text Ads.

“The reason why bidding … is the most important change,” said Geddes, “is because advertisers don’t have to do something … it does not put a burden of change on advertisers, so it’s the most positive change for savvy advertisers, but in many ways, the biggest news is the expanded text ads, because Google will retire the current ad format this year, and it puts the burden then on advertisers.”

Expanded Text Ads: a lot of work ahead & a lot of unknowns

“Expanded Text Ads (ETAs) are hands down the biggest news,” agrees Rottgerding. “Other things are nice as well, but this one will keep us occupied over summer. My impression is that Google is trying to get this out as fast as possible, maybe a bit faster than they should.”

This is the big change we first reported in April that will apply to all text ads. It was officially announced last week that Google will do away with the 25-35-35-character ad format of the past 15 years and switch to a 30-30-80-character format, with the first two lines displaying as a double headline.

With all that testing history coming to an end, Geddes says, “People are worried. We run an ad testing company, and after the announcement, our email just blew up … [Advertisers] know they’ll have to do somethingm but they don’t know what yet.”

Google has yet to discuss how the new changes are going to roll out, including if there will be dynamic or auto-migrations for advertisers that don’t upload longer ads on their own.

Rottgerding expects there to be a short transition phase before Google removes the ability to create regular text ads. “I don’t see them removing regular text ads completely, as they cannot automatically migrate everything, and they don’t want to lose those advertisers who are just happy spending $100 per month without ever logging in. In any case, advertisers who make the transition early will benefit in terms of Quality Score — not because Google wants to reward or punish anyone, but because Quality Score is about CTR, and CTR will be higher with the new format.”

Röttgerding pointed out that despite Google’s emphasis on mobile throughout GPS, many of the updates reflect a away from having to customize ads and bidding for devices. And while Google again hasn’t provided any details on this, Karooya.com noted that the AdWords API note appears to indicate that the mobile-preferred check box for ads will disappear with Expanded Text Ads.


Halpert thinks having more room to describe features and benefits, particularly for certain industries, will be very helpful. “The short character limits in current text ads really limit creativity, especially for emerging brands or categories where we need more space to explain the benefit of the product.”
I look forward to seeing what advertisers do with the extra characters. Though I remain skeptical about how long the CTR benefits will last once everyone is up and running with these, I’ll be happy to be proven wrong.

The biggest underdog announcement: similar audiences for search

Google has offered very little public detail on its announcement that it is finally going to let advertisers tap its trove of user data for search targeting. Demographic and similar audience targeting for search was not included in Google’s official blog post on the updates and only mentioned briefly during the presentation. But it potentially has big ramifications – “huge” was the common theme here.
“Depending on how the audiences are calculated, this could be huge, yet it was just mentioned in passing,” said Larry Kim of WordStream, who was also in attendance. “I’m also hopeful that the demographic targeting for search ads goes well and is expanded to many more targetable demographics and behaviors.”
“Similar audiences for search will have a huge impact on clients,” said Newton. “We’ve already come up with some really innovative strategies, and similar audiences will help to grow accounts efficiently — the holy PPC grail!”
“I think it’s going to be huge,” agrees Geddes, who speculated on how it will work. “Google has had such wonderful insights into user demographics and user interests that’s not first-party given. They’ve been very good at saying, ‘These are the sites you’ve been on, this is who you are’. . . but they’ve not used it for years and years and years, and it’s always been a thing holding them back. That they’re really switching to audience + search is amazing. Facebook is only audience. We’re only search. How do we do better and combine the two together?
“We can now take these search intent terms and target users differently — different keywords, different ads — based on direct information or indirect information.”
Frederick Vallaeys of Optmyzr thinks this move with longer text ads is going to shift SEM’s approach to marketing. “I think that demographic controls for search will have the biggest impact because as costs continue to rise, this gives advertisers a big lever to improve targeting so that their CPA and ROAS can remain reasonable. Between this and the expanded text ads, it means that online marketers will have to become more like traditional marketers who have to craft the right message for the right user.”

Other hidden gems

Asked what other news may not have gotten as much attention but will likely benefit advertisers in ways that might not yet be apparent, Larry Kim said, “If you’re a local business, the combination of new Google Maps Local Search ads and in-store conversions is absolutely a killer combination!”

Vallaeys is happy to see the control of device bidding along with the new promoted pins on Maps, which let Google do the work of coupling advertisers’ feeds with its “deep knowledge about what users might want to automatically promote the right business. What I like is that the automated solution can help advertisers get more volume from mobile whereas the additional control can help us make sure that new traffic is as profitable as it needs to be.” Google also is looking at helping small businesses with gathering in-store conversion data, perhaps with beacons. “This is critically important to small businesses because if they can’t measure conversions as accurately as larger companies, their bids will be based on bad data and it would be very hard to compete on a level playing field,” said Vallaeys.

Elizabeth Marsten of CommerceHub, thinks the expansion of Google’s store visits measurement is the biggest news to come out of GPS for e-commerce advertisers. Believing the bidding update was “an eventual revision,” Marsten said, “The impact isn’t going to be nearly that of being able to close some of that gap between offline store visits and mobile searches. [Store visits measurement] is going to do big things for how we measure and credit ‘mobile conversions’. Right now, we end up using modifiers to bid down more often in e-commerce, because we need that last click ROAS target to be met and there’s no definitive ability to split that credit with a physical store.  With this, we start taking those important steps to making the language and action of multi-touch attribution much more accessible and trusting in those numbers than ever before.”
Rotterding was surprised attribution wasn’t discussed in the keynote, particularly since Google just recently announced the coming release of attribution models beyond last click for AdWords conversions. “Personally I believe attribution is a very big deal, and this is probably the biggest news right after ETAs, but apparently, Google isn’t going to make a big deal out of it.”
Newton says she’s excited to see Customer Match Uploader. “Although we built a tool a while back to automatically upload first-party data to AdWords, Facebook and Twitter every day, so CMU will be a bigger benefit to advertisers who aren’t our clients.”

“If used correctly, Native Ad Units on the GDN will be a great tactic for advertisers,” predicts Freid. “While they may not drive the same type of traffic or conversions that [a] traditional SEM campaign [does], if you have a goal of promoting quality content or using advertorial types of advertising, these ad formats plus the targeting capabilities of the GDN network can provide advertisers a great way to get their brand and content in front of a highly targeted audience.”

Newton added, “I still think there needs to be more work done to improve app campaigns and focus more on LTV, rather than just Cost per Install,” said Newton. “I think we’re starting to head in that direction.”
On the analytics front, Marsten was impressed with the voice-activated Data Assistant demoed during the keynote. “It may not be really actionable for us right now, but I think we’re going to see some fascinating long term effects and maybe even start to use match types differently as a result. Can you imagine someday if you were able to do voice search as a campaign type like we have for shopping now? We know that the query style in which people use voice search is different than when they type, the ability to be able to segment and serve ads to match could be wonderfully powerful.”

Lastly, I’ll note that Google also released a free version of Google Data Studio for reporting on AdWords, Analytics, YouTube and other marketing source data. It’s not a core feature, of course, but could prove to be a useful resource for advertisers and agencies. And, unlike most of the other announcements made at GPS, which Google gave launch timelines of “in the coming months,” if any at all, Data Studio is already available.

Complete SEO Meta and Social Media Declaration Tag by Fixmansion

Here is another post on SEO (Search Engine Optimization). One of the reasons I love writing about blogger platform is that blogger is the most popular with easy CMS platform. Today I will be writing about how to add a complete SEO Meta Tag and Social Media Declaration Tag to a blogger blog. Don't forget, SEO is the most important aspect of blogging.


Functions of SEO Meta Tag Pack.

Meta Tags gives search engines bots a brief review of the structure and it helps them to fully understand how the blog operates. It is compulsory for every blogger to have a comprehensive and unique Meta tag to boost the SEO of blog. Meta tags saves the stress of indicating your title, body, style etc.. It automatically indicate the <title> tag which works for the title of post and pages. It's important that the title must be after the <head> tag. Am saving you that stress by providing a full SEO Meta Tag and Social Media Declaration Tag for your blogger blog.

In this post I shared a full SEO meta tag pack that will keep you ranking high is search results and to make your social media activities visible on the wen

Complete Feature of SEO Meta Tag.

  1. Optimized Posts Title Show posts title first on search results. 
  2. Optimized blogger comments: 
  3. Optimized Archive pages:
  4. Optimized Blogger labels: 
  5. Optimized keywords meta tag:  
  6. Google, Bing and Alexa verify by verification code: 
  7. SEO friendly robots.txt file by tag.
  8. Convert title tags into dynamic title tags:
  9. Convert title on 404 error page
  10. Facebook and Twitter profile compatible
  11. Allow bots to crawl your site daily
  12. Google + Author name profile picture Compatible
  13. Facebook user name and Page name Compatible
Important Notice.
Every blog comes with default Meta Tag, so you must clear the previous tags before adding this full SEO Meta Tag.

How To Add SEO Meta Tag To A Blogger Blog.


1- Login to the Blogger Dashboard>>Template>>Edit HTML.
2- Locate <head> and paste the below code below it.

-------------> Codes Start <---------------------

<meta charset='utf-8'/>
<meta content='width=device-width, initial-scale=1, maximum-scale=1' name='viewport'/>
<meta content='blogger' name='generator'/>
<meta content='text/html; charset=UTF-8' http-equiv='Content-Type'/>
<link href='http://www.blogger.com/openid-server.g' rel='openid.server'/>
<link expr:href='data:blog.homepageUrl' rel='openid.delegate'/>
<link expr:href='data:blog.url' rel='canonical'/>
<b:if cond='data:blog.pageType == &quot;index&quot;'>
<title><data:blog.pageTitle/></title>
<b:else/>
<b:if cond='data:blog.pageType != &quot;error_page&quot;'>
<title><data:blog.pageName/> - <data:blog.title/></title>
</b:if></b:if>
<b:if cond='data:blog.pageType == &quot;error_page&quot;'>
<title>Page Not Found - <data:blog.title/></title>
</b:if>
<b:if cond='data:blog.pageType == &quot;archive&quot;'>
<meta content='noindex' name='robots'/>
</b:if>
<b:if cond='data:blog.searchLabel'>
<meta content='noindex,nofollow' name='robots'/>
</b:if>
<b:if cond='data:blog.isMobile'>
<meta content='noindex,nofollow' name='robots'/>
</b:if>
<b:if cond='data:blog.pageType != &quot;error_page&quot;'>
<meta expr:content='data:blog.metaDescription' name='description'/>
<b:if cond='data:blog.homepageUrl != data:blog.url'>
<meta expr:content='data:blog.pageName + &quot;, &quot; + data:blog.pageTitle + &quot;, &quot; + data:blog.title' name='keywords'/>
</b:if></b:if>
<b:if cond='data:blog.url == data:blog.homepageUrl'>
<meta content='YOUR, KEYWORDS, HERE' name='keywords'/></b:if>
<link expr:href='data:blog.homepageUrl + &quot;feeds/posts/default&quot;' expr:title='data:blog.title + &quot; - Atom&quot;' rel='alternate' type='application/atom+xml'/>
<link expr:href='data:blog.homepageUrl + &quot;feeds/posts/default?alt=rss&quot;' expr:title='data:blog.title + &quot; - RSS&quot;' rel='alternate' type='application/rss+xml'/>
<link expr:href='&quot;http://www.blogger.com/feeds/&quot; + data:blog.blogId + &quot;/posts/default&quot;' expr:title='data:blog.title + &quot; - Atom&quot;' rel='alternate' type='application/atom+xml'/>
<b:if cond='data:blog.pageType == &quot;item&quot;'>
<b:if cond='data:blog.postImageThumbnailUrl'>
<link expr:href='data:blog.postImageThumbnailUrl' rel='image_src'/>
</b:if></b:if>
<b:if cond='data:blog.url == data:blog.homepageUrl'>
<b:if cond='data:blog.pageType == &quot;item&quot;'>
<b:if cond='data:blog.pageType == &quot;static_page&quot;'>
<b:if cond='data:blog.url'>
<meta expr:content='data:blog.url' property='og:url'/>
</b:if>
<meta expr:content='data:blog.title' property='og:site_name'/>
<b:if cond='data:blog.pageName'>
<meta expr:content='data:blog.pageName' property='og:title'/>
</b:if>
<meta content='website' property='og:type'/></b:if></b:if></b:if>
<b:if cond='data:blog.postImageThumbnailUrl'>
<meta expr:content='data:blog.postImageThumbnailUrl' property='og:image'/>
<b:else/></b:if>
<link href='/favicon.ico' rel='icon' type='image/x-icon'/>
<link href='https://plus.google.com/GOOGLE+ID/posts' rel='publisher'/>
<link href='https://plus.google.com/GOOGLE+ID/about' rel='author'/>
<link href='https://plus.google.com/GOOGLE+ID' rel='me'/>
<meta content='GOOGLE-WEBMASTER-CODE' name='google-site-verification'/>
<meta content='BING-WEBMASTER-CODE' name='msvalidate.01'/>
<meta content='ALEXA-VERIFY-CODE' name='alexaVerifyID'/>
<meta content='Lagos, Nigeria' name='geo.placename'/>
<meta content='YOUR NAME' name='Author'/>
<meta content='general' name='rating'/>
<meta content='Nigeria' name='geo.country'/>
<meta content='en_US' property='og:locale'/>
<meta content='en_GB' property='og:locale:alternate'/>
<meta name="language" content="english"/>
<meta content='https://www.facebook.com/Oyedeji.olawale.50' property='article:author'/>
<meta content='https://www.facebook.com/Nigernote' property='article:publisher'/>
<meta content='FACEBOOK-APP-ID' property='fb:app_id'/>
<meta content='https://www.facebook.com/Oyedeji.olawale.50' property='fb:admins'/>
<meta content='@slim_olawizzy' name='twitter:site'/>
<meta content='@slim_olawizzy' name='twitter:creator'/>

-------------> Codes End <-----------------

Customization.


YOUR, KEYWORDS, HERE
: Type your main keywords.
GOOGLE+ID: Your Google Plus profile id (replace 3 times).
GOOGLE-WEBMASTER-CODE:  Google webmaster tools verification code.
BING-WEBMASTER-CODE: Bing webmaster tools verification code.
ALEXA-VERIFY-CODE: Alexa Verify code.
Lagos, Nigeria: Your state and country name.
YOUR-NAME: Blog's Admin name.
Nigeria: Your country name.
english: Your content language
Oyedeji.olawale.50: Facebook user name.
Nigernote: Facebook page user name.
FACEBOOK-APP-ID: Facebook app id. (make here)
FACEBOOK-ADMIN-ID: Your Facebook ID. (find here)
@slim_olawizzy: Your Twitter username (replace 2 times).


Now we have successfully added a complete SEO Meta Tag to a Blogger Blog. We are not done yet, now let's add Social Media declaration Meta Tag. This declaration code makes your blog's Social Media activities visible to Search Engine bots. Paste the below code below the end of the SEO Meta Tag we pasted before.

---------->  Codes Start <----------------------

<script type="application/ld+json"> { "@context" : "http://schema.org", "@type" : "Organization", "name" : "BLOG-NAME", "url" : "BLOG-URL", "sameAs" : [ "https://twitter.com/slim_olawizzy", "https://plus.google.com/+Fixmansion1", "https://www.facebook.com/FB PAGE URL","https://foursquare/v/FOURSQUARE PAGE URL" ] } </script>

------------> End <--------------

Customization
BLOG-NAME: Replace with the name of your blog.
BLOG-URL: Replace with the URL of your blog.
Slim_olawizzy: Replace with your Twitter Username. 
+Fixmansion1: Replace with your Google+ Page URL. 
FB PAGE URL: Replace with your Facebook Page URL. 
FOURSQUARE PAGE URL: Replace with your Foursquare Page URL.

Finally its done. If you found any problems, then feel free to inform me on comment section. If this post is helpful, then do not forget to share our posts with your friends and keep visiting.

Article Source: http://www.fixmansion.com/2016/06/complete-seo-meta-and-social-media-tag-for-blogger-blog.html

Google Reports Progress on a Shortcut to Quantum Supremacy

Quantum computers could be closer than we thought, thanks to new steps toward an easier way to build them.

by Tom Simonite June 9, 2016

A computer that uses the quirks of quantum physics to work on data should be capable of things far beyond any machine in use today. Governments and large tech companies have spent huge sums trying to prove out that idea. Yet quantum computers have sometimes seemed like one of those technologies that are always 20 years away.

Recently some leading research groups have come to think they can see a path to shortening that time considerably. Yesterday Google and researchers from the University of the Basque Country in Bilbao, Spain, published results that could lead to a shortcut to the long-awaited first conclusive demonstration of the power of quantum computing.

The new result is one of the first fruits of a plan Google’s quantum researchers laid out when I visited their new lab last year.


At the heart of that effort is a decision to move away from a design that has so far sucked up most of the field’s money and effort. Digital quantum computers, as they are called, are modeled on the way our computers work today, and the design has been rigorously proved out by theorists. But they would require a lot of error-correcting hardware and software to compensate for the delicacy of the quantum effects they use to work with data.

Google, IBM, and others (including a startup) are now ramping up work on an alternative model known as analog quantum computers.

These designs work less like a conventional computer and are less well understood theoretically. And they would still need a way to deal with errors. But the burden of error correction should be much smaller. As a result, it should be much easier to demonstrate the power of a quantum computer this way.

The leader of Google’s quantum hardware project, veteran researcher John Martinis, told me last year that it could take just a few years to make a chip complex enough to do that. The paper his group and researchers at the University of the Basque Country published Wednesday shows progress is being made.

The team used the analog quantum computing approach to program a superconducting quantum chip to simulate nine atoms interacting magnetically. That was made possible by drawing on some of the error correction techniques developed in earlier work on the harder-to-scale-up digital quantum computing.

The chip used had nine of the basic building blocks of a quantum computer, known as qubits. It would take an analog quantum computer with 40 or more to demonstrate what researchers charmingly call “quantum supremacy”—meaning a system that can conclusively demonstrate things impossible for a conventional computer. (Startup D-Wave Systems has demonstrated chips with over 1,000 qubits, but despite promising results, they have not been conclusively proved to confer the benefits of a quantum computer.)

Google says it can scale up to that point relatively quickly, and other researchers in the field say it’s credible.

It would likely take scaling up a little further to do useful work with an analog quantum computer. If and when Google or some other company does that, the devices could be used to crack tough chemistry problems in health or energy by simulating atoms to a level of realism impossible today.

Google also believes that quantum supremacy could advance its research in machine-learning and artificial-intelligence technology, which underpins CEO Sundar Pichai’s claim that the company has entered an “AI first” era.

Hartmut Neven, who leads Google’s work on figuring out what to do with quantum computers once they arrive, hopefully told me last year that the power of quantum-enhanced artificial intelligence could sweep away today’s technology. “I would predict that in 10 years there’s nothing but quantum machine learning—you don’t do the conventional way anymore,” he said.

Article Source: https://www.technologyreview.com/s/601668/google-reports-progress-on-a-shortcut-to-quantum-supremacy/

2 Ways semantics Affects Your Google Ranking

Here are 2 examples of how Google ranking is now based on semantics structures in accordance with their new patent.

Google posted their patent defining how semantic distance between terms in a document affects modern-day SEO and Google ranking.

First Example refers to Page Title, Headings, Content and Keywords and how it affects Google Ranking.

How we use our heading elements and lists plays an integral role when we consider how the Search Engines find us today. The list of signals used by Google to identify the ranking placement has grown extraordinarily, and focus is now being placed more and more on quality and importance of the website, while others depend immensely on the search keywords.


Semantic Closeness as a Ranking Signal defined by Google

You can clearly see in the snapshot above that in order for me to land on Page One of the Google search “Write For a Living”, it was essential for me to use this term in my Page Title, Heading 2, First Paragraph, and in the content.

Significance is then placed on the importance and relevance of my page to Google regarding helping writers write for a living.

Example 2 refers to listings and Semantic Structures.


Lists amplify search words

You can deduce from the above screenshot that using lists drives your SEO. Each item listed is semantically amplified because they are all relevant to the keywords, which you find in the Title.

It would also then be safe to learn that the visual distance in each listing would then in no way lower your SEO purely because the “listing” effect binds the items, the keywords, and the title.

By discerning Semantic Closeness from the above example we can see that the Search Engines still find my page relevant in terms of “Write”, “Freelance Writing”, “Writing Careers”, and “Writing Jobs”

Article Source: http://thewritestyles.com/2-ways-semantics-affects-your-google-ranking/

The Latest Ad Specifications for Social Networks (Infographic)

By David Cohen 

Advertising on social networks is constantly evolving and shifting, making it that much more important for brands and agencies to keep up with the latest specifications.

Banner maker and advertising application Bannersnack provided the infographic below, which shares that information for Facebook, Instagram, Twitter, Pinterest, LinkedIn, YouTube, Snapchat and Reddit.


Article Source: http://www.adweek.com/socialtimes/bannersnack-latest-ad-specifications-social-networks-infographic/640728

Twitter tests stamping Moments directly onto your timeline


When Twitter introduced Moments in October, it was supposed to be one of the biggest changes to how people use the platform. Of course, that depended on people actually using it.

Now it seems Twitter might force-feed you moments in your timeline in the form of a carousel with five trending topics. You can then tap on topics to enter a full-screen view to scroll through the Moments normally.

First written up by Engadget, a few users in countries where Moments has been activated are seeing the test show up on both iOS and Android. Twitter has since confirmed the test, providing the following statement:
Moments are awesome for catching up with the latest stories unfolding on Twitter. Because we’re always working on new ways to bring the best content to our users, we’re experimenting with showing recommended Moments in the timeline.
In other words, don’t be surprised if this doesn’t show up on your device at all, although these small tests have a tendency to become real features after a few months.

For all the hype, I rarely end up using Moments myself. Not because it’s not a useful feature, but because they’re not one of the first things I see when I log on to Twitter. I have to remember to swipe to the Moments tab to use it, and given I mostly just look at Twitter in passing if I’m not working, that’s one step too many.

That’s precisely what Twitter is trying to change by putting up Moments right in your Timeline. Some users will be annoyed in the process, but it’s probably the most effective way to introduce Moments to a wider audience without a complete redesign.

Twitter is experimenting with adding 'Moments' to your timeline on Engadget


Article Source: http://thenextweb.com/twitter/2016/06/10/twitter-moments-timeline/